Azure Monitor is a powerful service that helps you maximize the performance and give you deep telemetry on your resources sitting in cloud and on-premises environments. You can get a clear picture of how you resource is behaving and perform action proactively to identify any arising issues before they indeed becomes an issue.
Let’s see how we can setup Alert Rules on Virtual Machine based on it’s CPU usage so that we can avoid any performance bottleneck on the machine and resize the resource if needed.
Login
Login to Azure Portal @ https://portal.azure.com
Monitor Setup
- Navigate to left blade in azure portal and select “Monitor” to see any preconfigured monitors.
- Choose “Alerts” from left-blade within the Azure Monitor window.
- Click “New Alert Rule” to create a new alert rule.
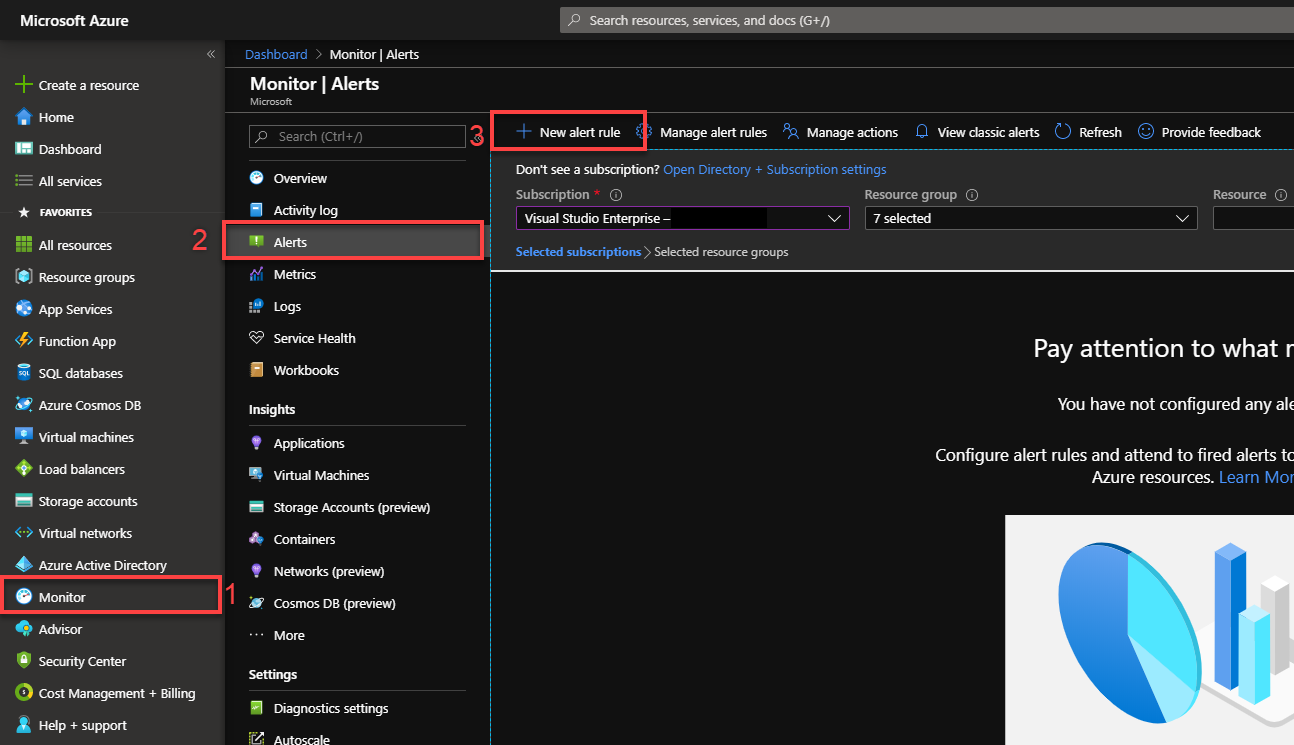
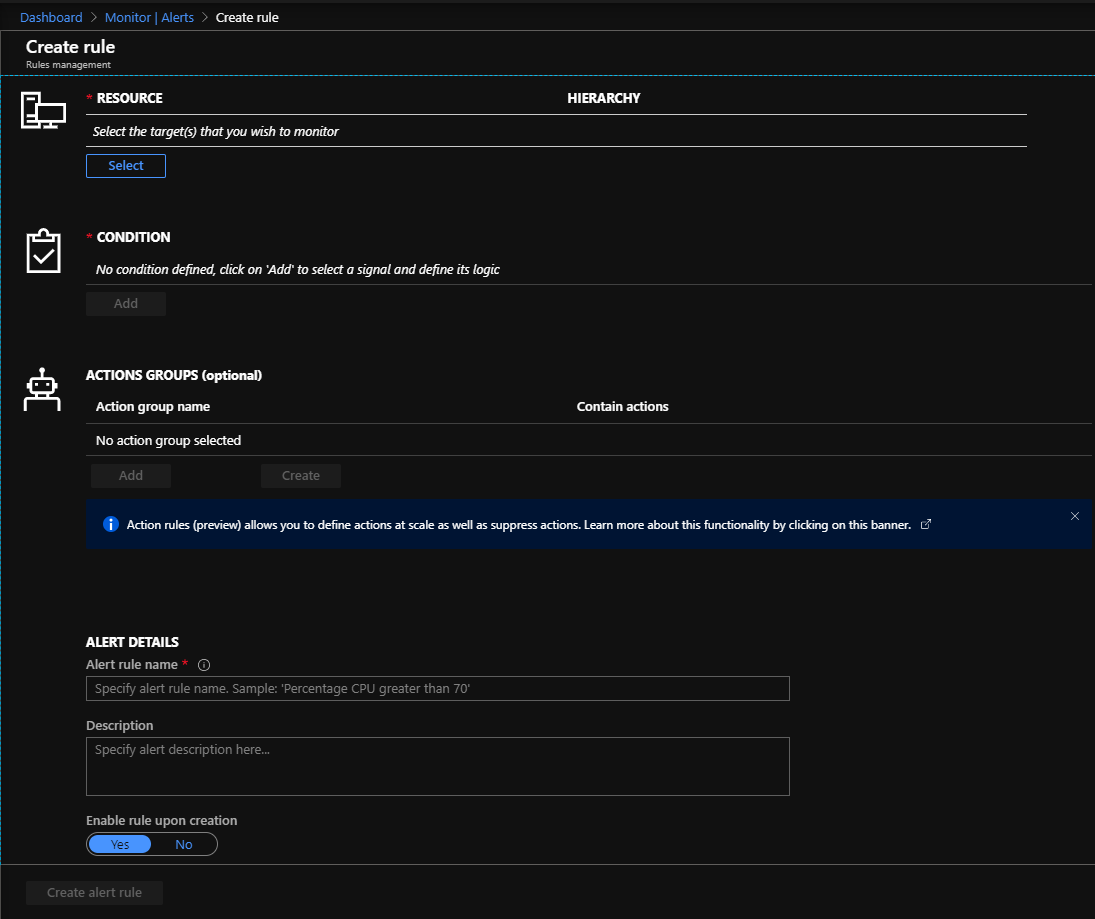
- You’ll need to fill out few different options in order to configure the alert.
* Resource = target resource that you want to apply the alert to
* Condition = specific rule that you want to trigger the alert based on
* Action Groups = alert action that you want to trigger once the condition is met
* Alert Detail = naming the alert rule and description for it’s purpose
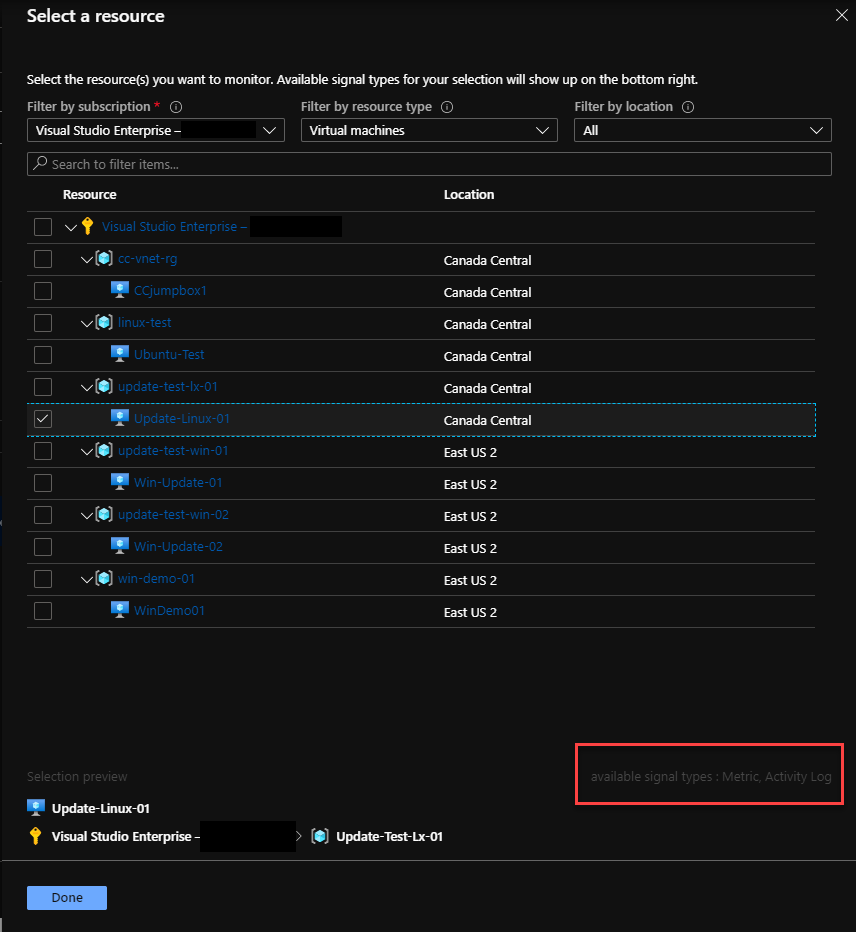
- Click on the Resource and choose the resource that you wish to monitor and get the alerts for. I’ll go with Virtual Machine inside my subscription.
Signal types will change here based on what type of resource you choose to alert on. VM only get “Metrics and Activity logs” unlike Storage Accounts, Web Apps and other resources.
At this point, you should see you target resource and now we’ll configure “Condition” to alert on.
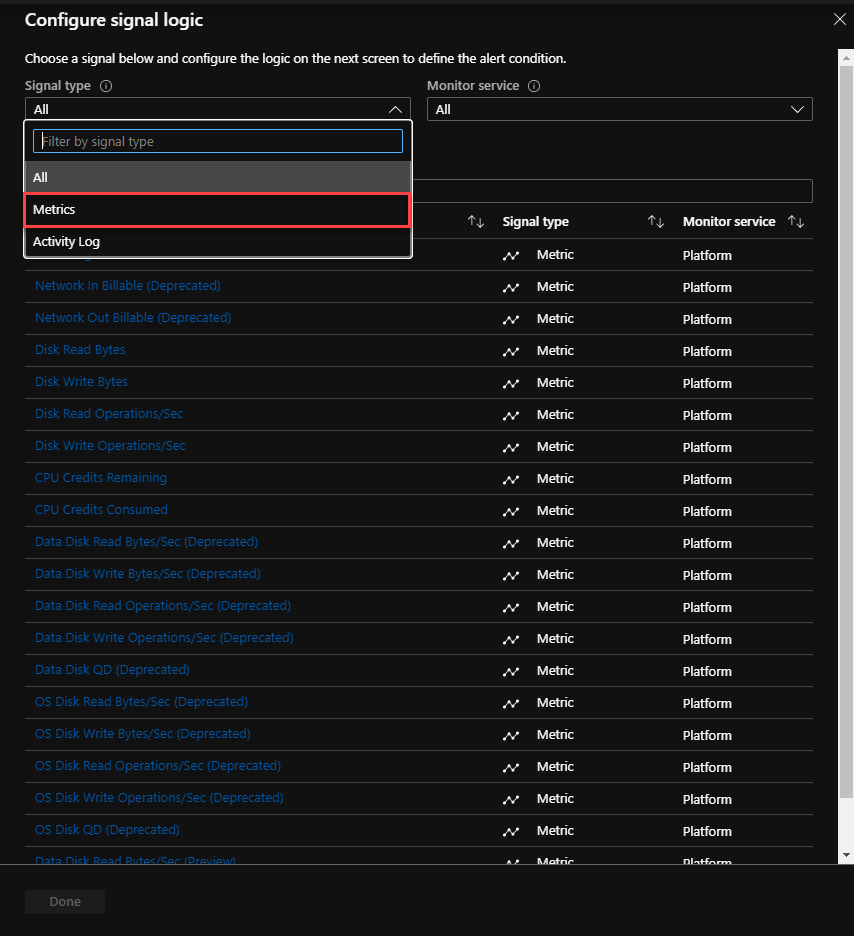
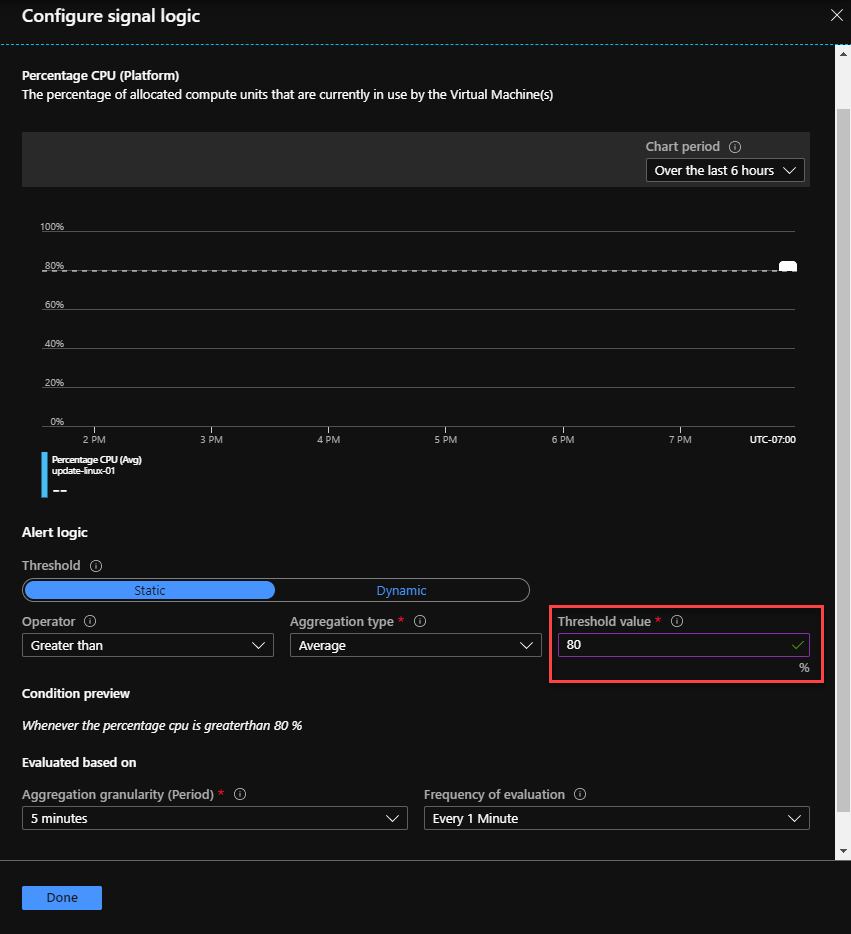
- Click “Add” under conditions and choose “Metrics” from the dropdown and select “Percentage CPU”.
- On the following screen, adjust the “Alert Logic” to your requirement. I’ll be setting the rule to alert me when the CPU usage goes over 80% on average.
You can also adjust “Aggregation granularity” and “Frequency of Evaluation” to define how often you want to check and evaluate the condition.
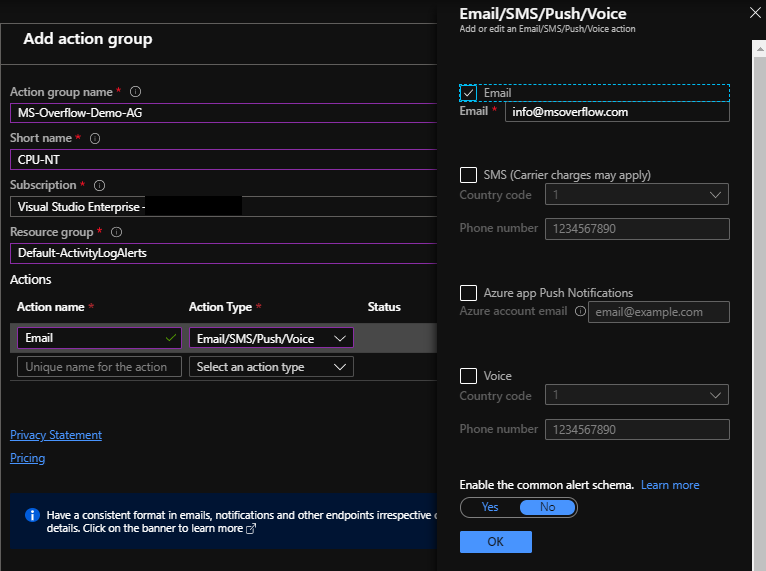
- Under “Action Groups”, you can choose if you already have any actions groups or create a new one from scratch.
* Enter a name for Action group and give it a location “Resource Group” to store the action groups component.
* Choose “Action Type” from the dropdown and select “Email/SMS..” to receive alerts via email whenever the alert is triggered and save the configuration.
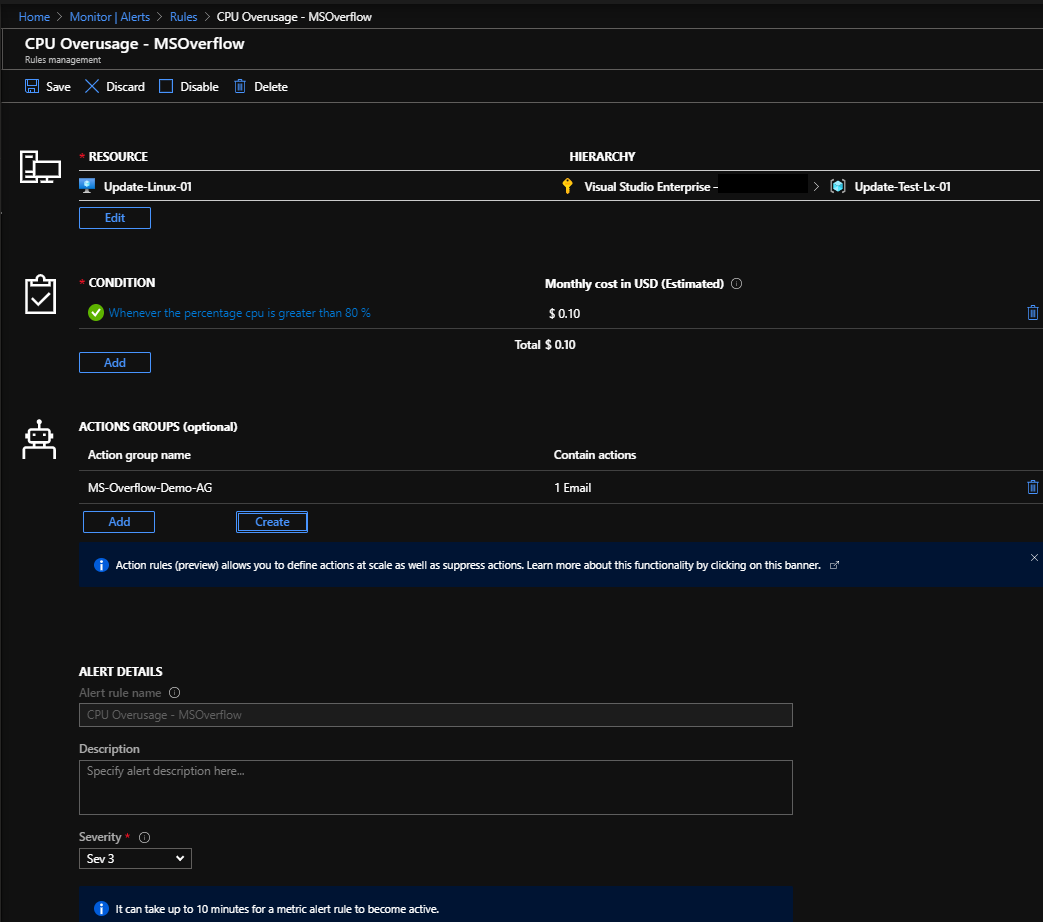
- Once you finish all the configuration, you should see the Alert rule something like this.
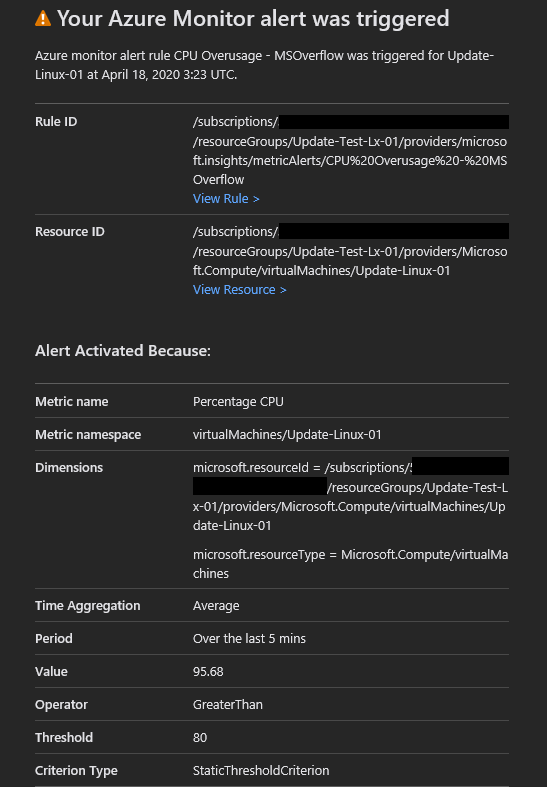
Alert Trigger
Here’s what you would see once the alert is triggered.
Conclusion
This was just one of capability of Azure Monitor within the subset of feature and it’s richness in how deep this can go in terms of monitoring and working through logs to trigger alerts based on anomalies and user defined actions.
I hope you get some value out of this.


